Performance Trend
Achievement Trends (Digest)
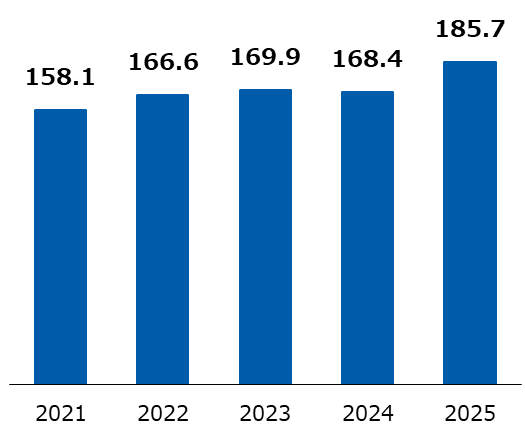
Net Sales
(billion yen)
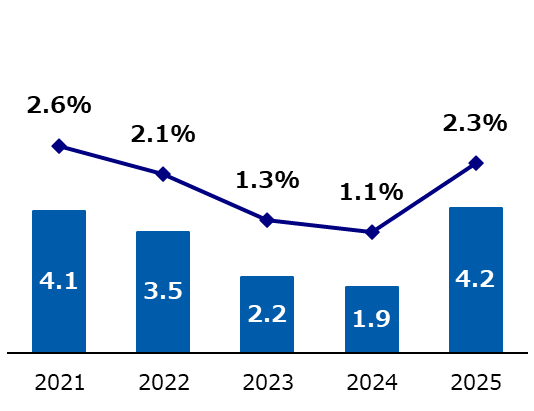
Operating Income & Operating Income Ratio(billion yen,%)
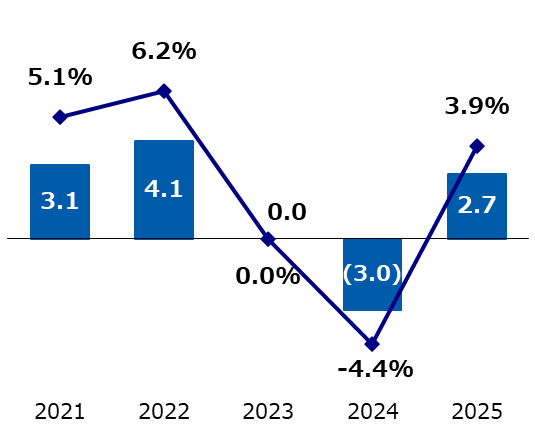
Profit(loss)attributable to owners of parents & ROE(billion yen,%)
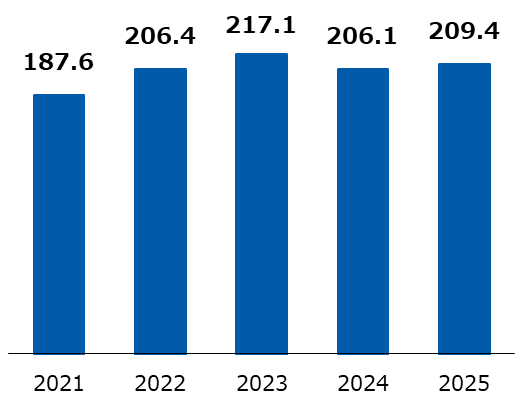
Total Assets
(billion yen)
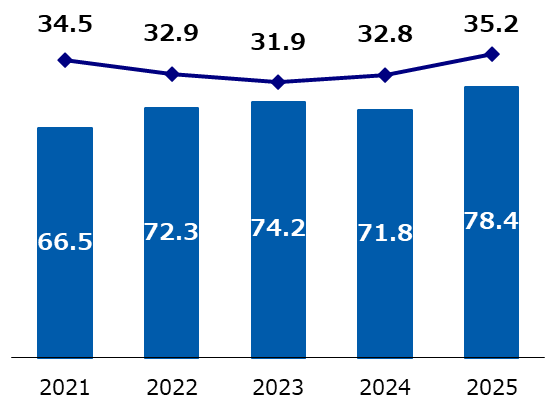
Shareholders’ Equity &
Shareholders’ Equity Ratio(billion yen,%)
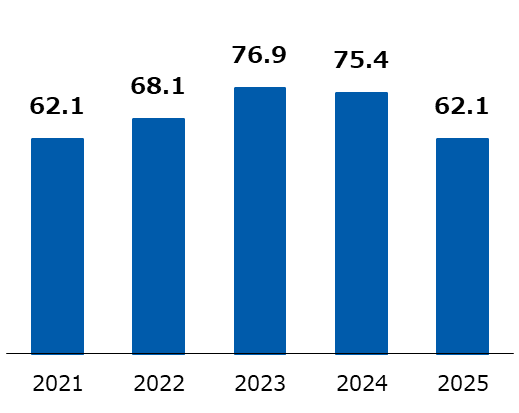
Interest-bearing Debt*
(billion yen)
Trends in consolidated performance
| Term
Financial Closing Year/Month |
The 98th Term
’21/12 |
The 99th Term
’22/12 |
The 100th Term
’23/12 |
The 101th Term
’24/12 |
The 102th Term
’25/12 |
|---|---|---|---|---|---|
| Net Sales (billion yen ) | 158.1 | 166.6 | 166.9 | 168.4 | 185.7 |
| Operating Income (billion yen ) | 4.1 | 3.5 | 2.2 | 1.9 | 4.2 |
| Ordinary Income (billion yen ) | 4.6 | 3.7 | 2.0 | 1.5 | 4.1 |
| Profit(loss)attributable to owners of parents (billion yen ) | 3.1 | 4.1 | 0.0 | (3.0) | 2.7 |
| Net Incomet per Share (Yen) | 141.4 | 182.1 | 1.3 | (133.6) | 121.9 |
| Return on Equity (%) | 5.1 | 6.2 | 0.0 | -4.4 | 3.9 |
| Total Assets (billion yen) | 187.6 | 206.4 | 217.1 | 206.1 | 209.4 |
| Shareholders’ Equity (billion yen) | 66.5 | 72.3 | 74.2 | 71.8 | 78.4 |
| Shareholders’ Equity per Share (Yen) | 2864.47 | 3006.74 | 3065.05 | 2986.80 | 3260.92 |
| Shareholders’ Equity to Total Assets Ratio (%) | 34.5 | 32.9 | 31.9 | 32.8 | 35.2 |
| CF from Operation Activities (billion yen) | 14.2 | (3.3) | (2.4) | 8.8 | 23.4 |
| CF from Investment Activities (billion yen) | (2.0) | (2.9) | (5.4) | (5.8) | (4.4) |
| CF from Financing Activities (billion yen) | (8.3) | 2.0 | 6.7 | (5.0) | (15.1) |
| Interest-bearing Liabilities (billion yen) | 62.1 | 68.1 | 76.9 | 75.4 | 62.1 |
| Number of employees | 5,371 | 5,454 | 5,457 | 5,292 | 5,199 |